
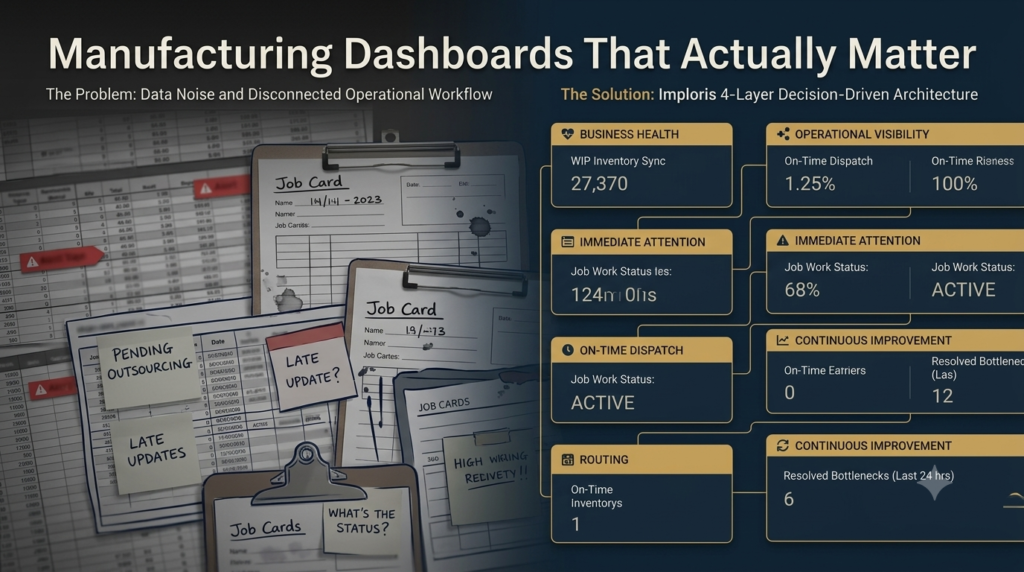
Manufacturing businesses generate a constant stream of information every day. Production updates, inventory movements, purchase requests, quality inspections, dispatch schedules, customer commitments, and financial transactions all contribute to understanding how the business is performing. Yet many owners and managers still begin their day by asking the same questions.
Which orders are progressing as planned?
What is holding up production?
Will today’s delays affect customer deliveries?
Are there any issues that could impact revenue or cash flow?
These questions are rarely difficult because information doesn’t exist. Most businesses already have reports from their accounting software, spreadsheets maintained by different departments, production registers, printed schedules, and countless conversations over phone calls or WhatsApp. The difficulty lies in bringing that information together in a way that supports timely decisions.
This is where many discussions around manufacturing dashboards become misleading. They often focus on charts, colours, and key performance indicators while overlooking a more fundamental question.
What decisions should the dashboard help you make?
A manufacturing dashboard is not a reporting tool for its own sake. It should provide business leaders with a clear understanding of what is moving, what is blocked, why attention is required, and where intervention will create the greatest operational impact.
A Dashboard Should Support Decisions, Not Display Data
Many software vendors showcase impressive dashboards filled with gauges, trend lines, heat maps, and dozens of performance indicators. While these visualisations may look impressive, they often leave business leaders searching for answers rather than finding them.
A dashboard that displays fifty metrics but fails to highlight today’s operational priorities creates more noise than clarity.
Business owners are rarely interested in monitoring every activity taking place on the shop floor. Their responsibility is to understand where the business is progressing well, where it is slowing down, and what decisions require immediate attention.
A good dashboard reduces uncertainty. It helps leaders focus their time where it matters most.
That is why dashboards should be designed around business decisions rather than software capabilities.
The Four Layers of an Effective Manufacturing Dashboard
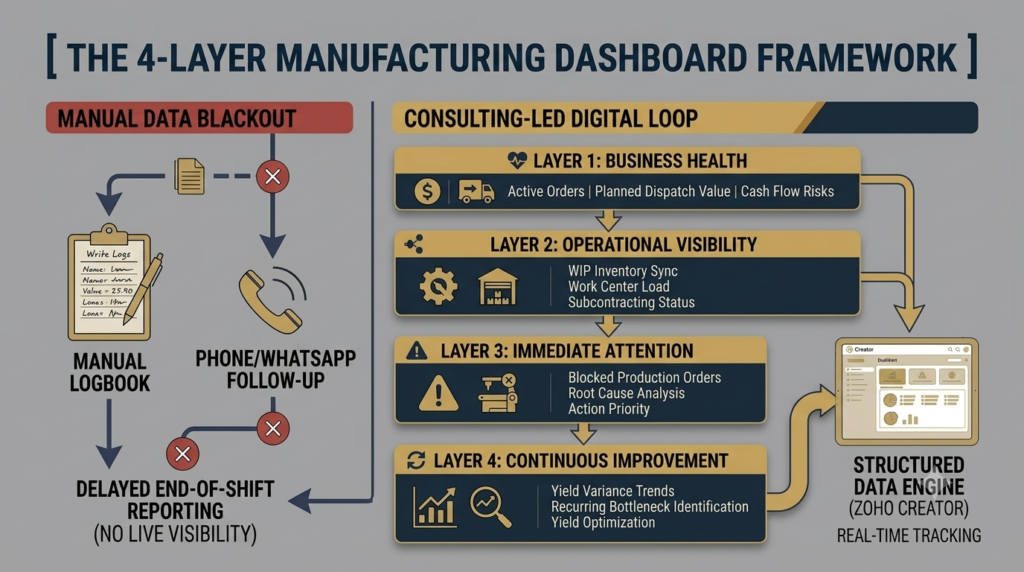
As manufacturing businesses grow, the volume of operational data naturally increases. Instead of presenting every available metric, dashboards should organise information into layers that reflect how business leaders think and make decisions.
Layer One: Business Health
Every day begins with understanding the overall health of the business.
At this level, the objective is not to analyse production activities in detail. It is to understand whether the business is moving in the right direction.
Typical questions include:
- How many customer orders are currently active?
- What is today’s planned dispatch value?
- Which deliveries are at risk?
- What invoices are expected to be raised today?
- Are there any immediate concerns affecting revenue or cash flow?
These indicators provide an overall business snapshot before leaders begin investigating operational details.
Layer Two: Operational Visibility
Once the overall business picture is understood, attention naturally shifts towards production.
Shop Floor Visibility & WIP Tracking should answer questions that help managers understand whether work is flowing through the factory as expected.
Examples include:
- Which production orders are currently in progress?
- Which work centres have pending workloads?
- Are there material shortages affecting production?
- Which jobs are waiting for quality approval?
- Which outsourced processes are yet to return?
Rather than overwhelming users with production statistics, this layer should identify where normal workflow has been interrupted.
Operational visibility allows managers to identify potential delays before they become customer issues.
Layer Three: Execution and Immediate Attention
Every manufacturing business experiences unexpected challenges during the day.
A supplier misses a delivery.
A machine requires maintenance.
A quality issue interrupts production.
A customer requests an urgent change.
The purpose of this layer is not simply to record the events but to identify where leadership attention is required.
Instead of displaying another list of metrics, the dashboard should answer questions such as:
- Which production orders are currently blocked?
- What is causing the delay?
- Who is responsible for resolving the issue?
- What impact will this have on dispatch commitments?
- Which decisions cannot wait until tomorrow?
A dashboard that helps leaders prioritise action becomes significantly a Manufacturing Bottleneck Identification which is more valuable than one that simply reports activity.
Layer Four: Continuous Improvement
Operational decisions should not focus only on today’s problems.
Over time, manufacturing businesses also need visibility into recurring patterns.
Questions such as these become increasingly important.
Are the same production bottlenecks appearing every week?
Which materials consistently create shortages?
Which quality issues continue to increase production costs?
Which outsourced processes regularly delay customer deliveries?
Trend analysis allows businesses to improve their processes instead of repeatedly reacting to operational issues.
This is where dashboards move beyond reporting and become valuable management tools.
Why Many Manufacturing Dashboards Fail
When dashboards fail to deliver value, the problem is rarely the dashboard itself.
The underlying operational process is usually the real issue.
If production updates are recorded several hours after work has been completed, the dashboard reflects delayed information.
If inventory movements are entered manually at the end of the day, material availability cannot be trusted.
If outsourced job work is managed through phone calls and WhatsApp messages, production visibility naturally disappears once materials leave the factory.
If different departments maintain separate spreadsheets, the dashboard simply combines inconsistent information into a single screen.
Technology cannot compensate for disconnected operational workflows.
It can only present the information that already exists.
This is why businesses sometimes invest in sophisticated reporting tools but continue making decisions through phone calls, spreadsheets, and manual follow-ups.
The dashboard is functioning exactly as designed. The operational workflow beneath it is not.
Good Dashboards Begin with Good Processes
One of the biggest misconceptions surrounding dashboards is that better visualisation automatically leads to better operational control.
In reality, dashboards are only as reliable as the processes that generate the information.
Accurate production updates depend on clearly defined workflows.
Inventory visibility depends on disciplined material transactions.
Quality reporting depends on consistent inspection processes.
Job work visibility depends on structured tracking rather than informal conversations.
When these operational foundations are in place, dashboards become a natural outcome rather than a separate implementation project.
The conversation should therefore begin with operational design before discussing charts, reports, or business intelligence platforms.
Operational Checkpoint
Before investing in another reporting tool, consider whether your business can confidently answer these questions at any point during the day.
- Which customer orders are currently delayed?
- What is preventing those orders from moving forward?
- Which production activities require immediate management attention?
- Are any material shortages likely to affect today’s production schedule?
- Which outsourced jobs are pending with external vendors?
- Will today’s production status affect planned dispatches or cash flow?
If obtaining these answers requires multiple spreadsheets, phone calls, or conversations across different departments, the opportunity is unlikely to be another dashboard.
The opportunity is to improve how operational information moves through the business.
Imploris Thoughts
Manufacturing dashboards are often presented as technology projects. In practice, they are management tools that reflect the quality of an organisation’s operational processes.
The most effective dashboards do not overwhelm business leaders with hundreds of performance indicators. They help answer a handful of important questions with confidence.
What is progressing as planned?
What is blocked?
Why is it blocked?
What requires immediate attention?
How will today’s decisions affect tomorrow’s business performance?
When dashboards are designed around these questions, they become more than visual reports. They become an essential part of daily operational management.
As manufacturing businesses grow, this clarity becomes increasingly valuable because better decisions rarely come from having more information. They come from having the right information at the right time.
Operational Reflection
At Imploris, we believe that a manufacturing dashboard should be the outcome of well-designed operational workflows, not the starting point of a digital transformation initiative.
Our approach begins by understanding how orders, materials, production, quality, job work, and dispatch move through your business. Once those workflows are connected, meaningful dashboards emerge naturally because the underlying information is already structured and reliable.
Technology can display operational visibility, but it is disciplined processes that create it.
Frequently Asked Questions
What should a manufacturing dashboard include?
A manufacturing dashboard should provide visibility into the information needed to make operational decisions. Beyond production output, it should include work-in-progress (WIP), inventory status, pending orders, delayed jobs, material availability, quality issues, dispatch readiness, and operational bottlenecks. A useful dashboard helps management identify where work is slowing down and what action needs to be taken.
Which KPIs matter most for manufacturing owners?
The most valuable KPIs depend on the business, but most manufacturers benefit from monitoring:
- Orders in progress
- Work-in-progress (WIP)
- Production delays
- Inventory availability
- Material variance
- On-time dispatch
- Pending purchase requirements
- Outstanding customer orders
- Production efficiency
- Cash flow linked to operational progress
The objective is to understand what is moving, what is blocked, and what requires immediate attention.
Can Excel be used as a manufacturing dashboard?
Excel works well during the early stages of a business and is still widely used by many manufacturers. However, as order volumes increase, multiple teams begin updating separate files, making it difficult to maintain a single source of truth. The challenge is usually not Excel itself but the manual processes required to keep information accurate and up to date.
How often should manufacturing dashboards be updated?
Operational dashboards should reflect changes as work progresses throughout the day. Waiting until the end of a shift or the following morning often means management is making decisions based on outdated information. Even if full real-time updates are not possible, businesses should aim for continuous updates at key workflow stages rather than manual end-of-day reporting.
Do small manufacturers need expensive dashboard software?
Not necessarily. Many growing manufacturers already have the information they need but struggle because it is spread across spreadsheets, paper records, messaging applications, and accounting systems. In many cases, improving workflow design and centralizing operational data provides more value than investing in expensive enterprise software. The priority should be building reliable processes that generate accurate data, with dashboards serving as the final layer for visibility.
Want to see what your manufacturing dashboard should actually look like?
If your management team still relies on manual spreadsheets, WhatsApp updates, or end-of-day paper logs, a structured 30-minute operational review will pinpoint exactly where shop floor visibility is being lost.
Book Your Manufacturing Operations Review